Examples
Visual showcase
The cover figure below is generated by the
examples/about-the-data/
example, which exercises every packaged boundary layer and spatial helper in a
single script.
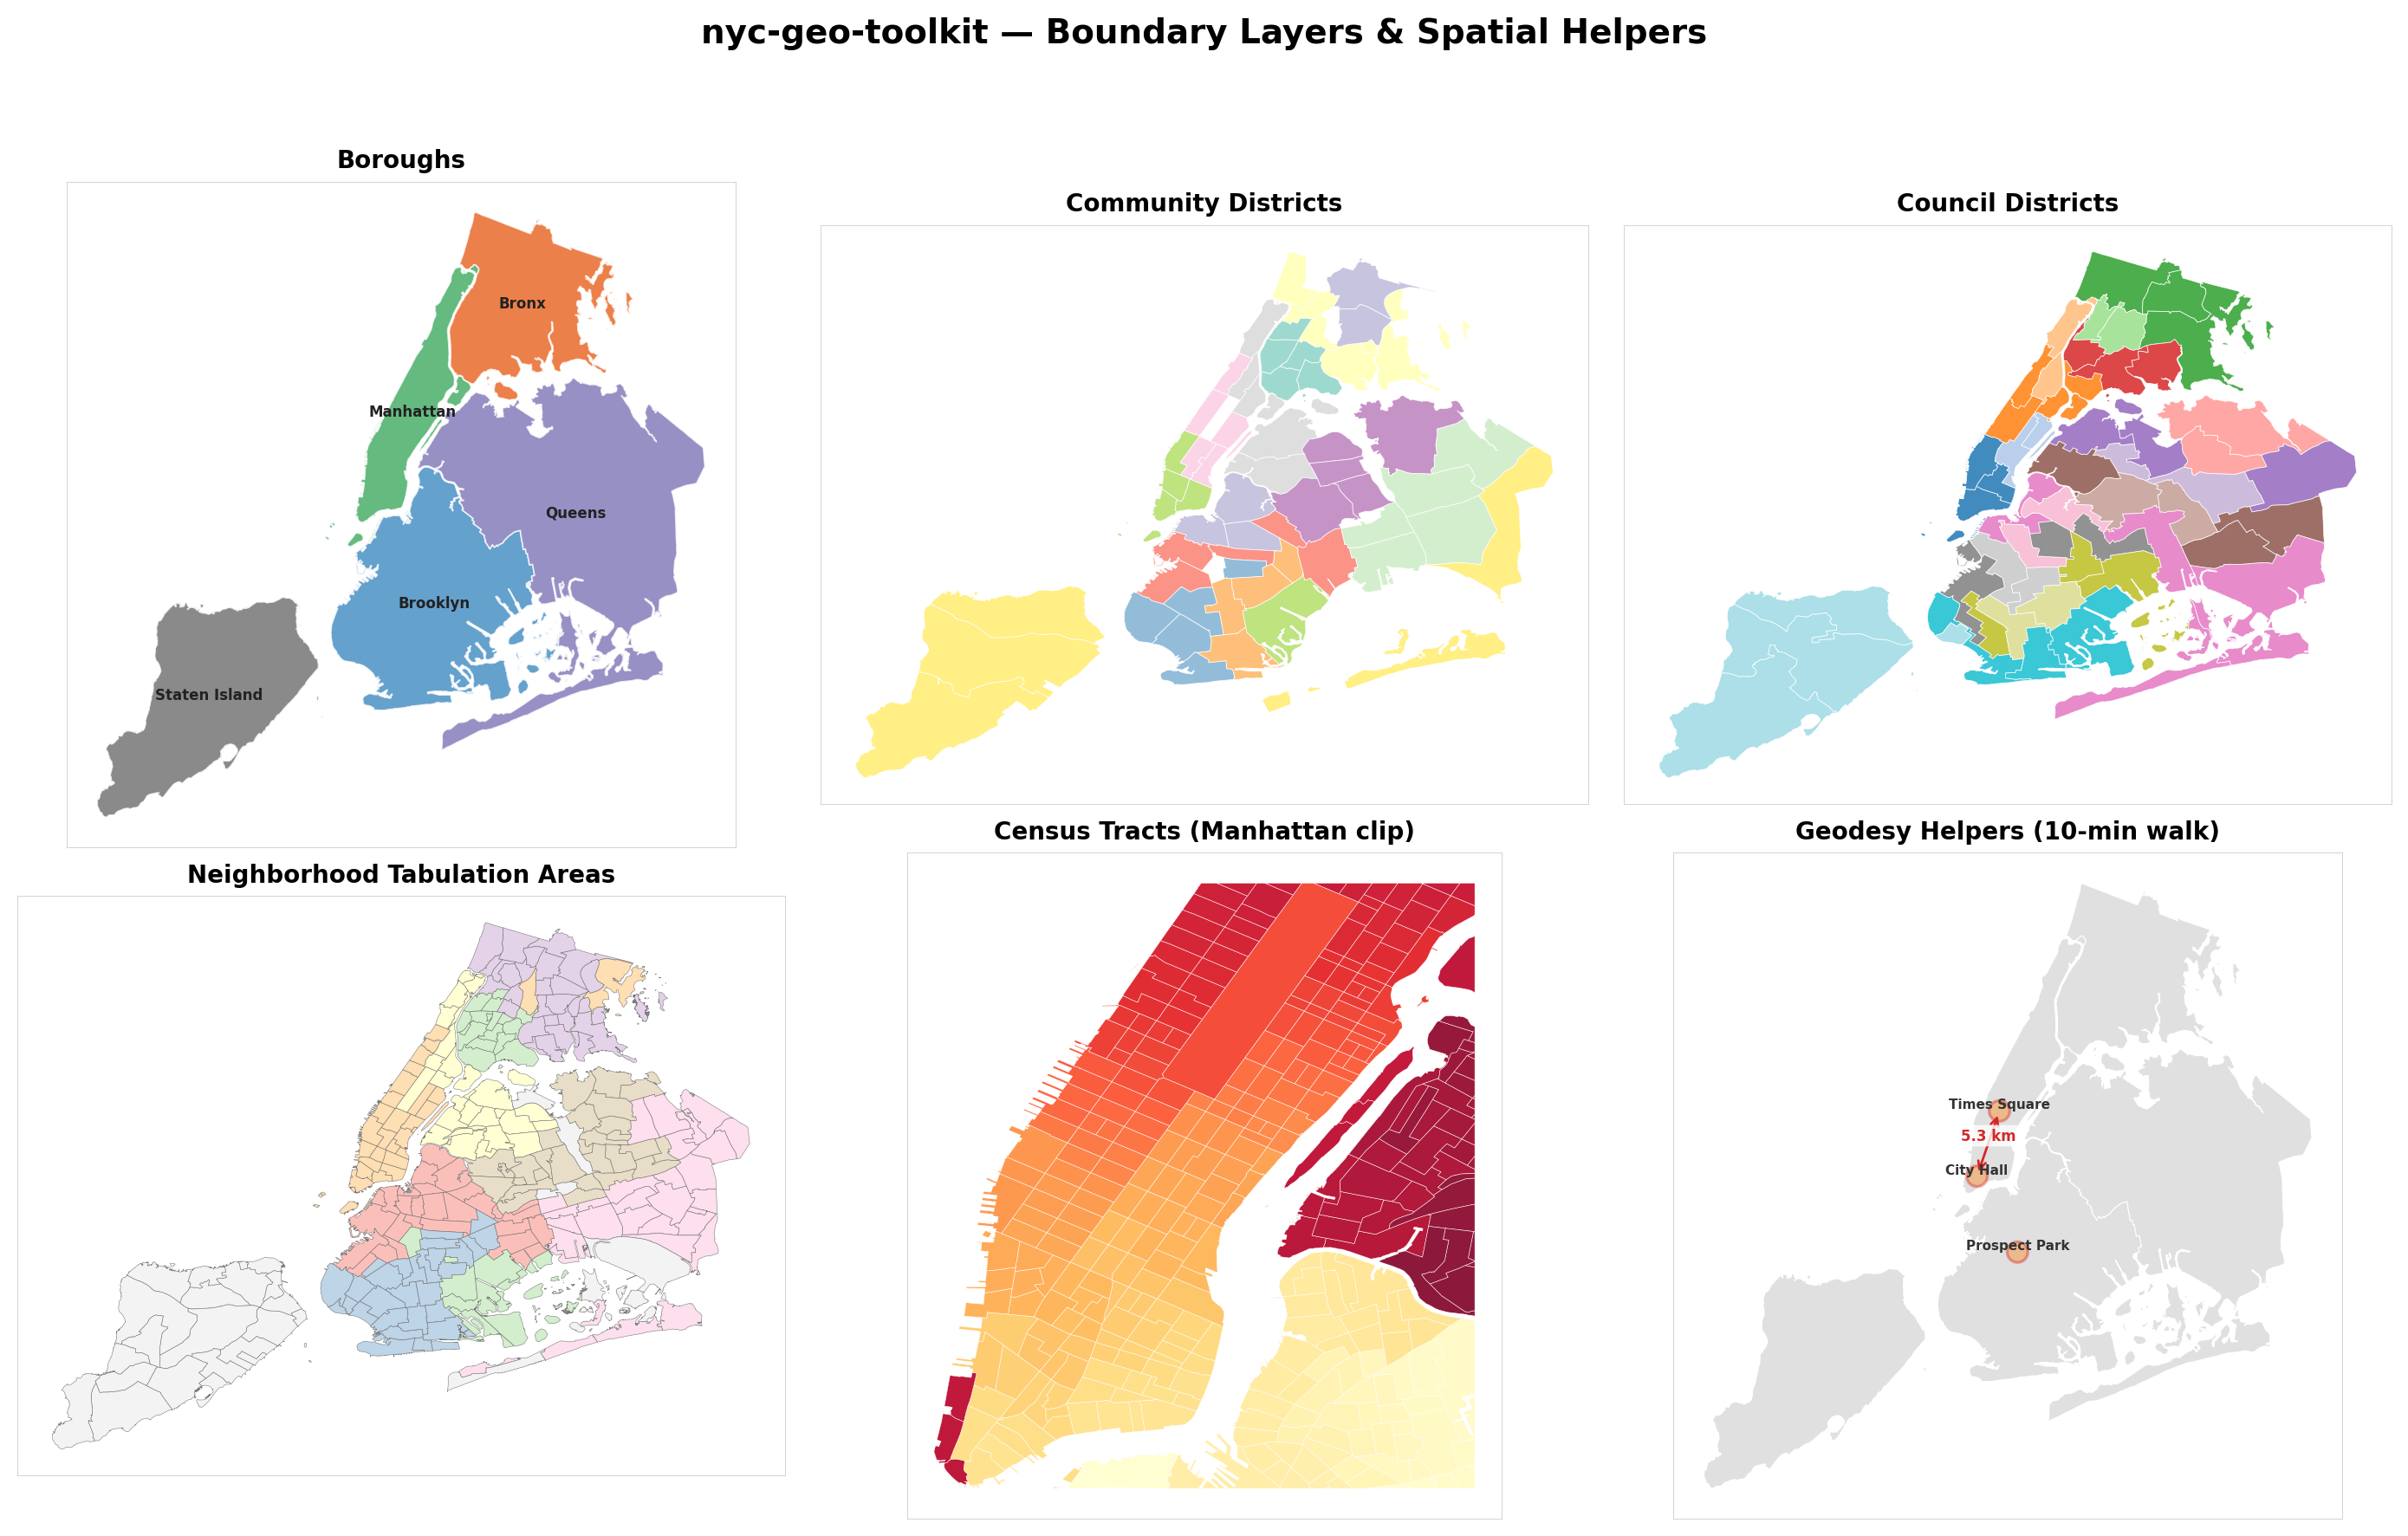
Panel breakdown
| Panel | Layer | Features | API demonstrated |
|---|---|---|---|
| Boroughs | borough |
5 | load_nyc_boundaries_geodataframe(), to_web_mercator(), add_osm_basemap() |
| Community Districts | community_district |
71 | load_nyc_boundaries_geodataframe() |
| Council Districts | council_district |
51 | load_nyc_boundaries_geodataframe() |
| NTAs | neighborhood_tabulation_area |
195 | load_nyc_boundaries_geodataframe() |
| Census Tracts (clipped) | census_tract |
varies | load_nyc_boundaries(), clip_boundaries_to_bbox() |
| Geodesy Helpers | n/a | 3 circles | build_circle_polygon(), walk_radius_meters(), haversine_distance_meters() |
Generating the figure
cd examples/about-the-data
uv run python main.py
# -> artifacts/nyc-geo-toolkit-cover.png
Self-contained examples
Each example in the examples/ directory is a standalone project with its own
pyproject.toml and can be run independently.
About the Data
Kitchen-sink visualization of every boundary layer and spatial helper. Generates a multi-panel cover figure.
cd examples/about-the-data && uv run python main.py
Boundary Quickstart
Loads a single borough boundary and exports it as GeoJSON.
cd examples/boundary-quickstart && uv run python main.py
Normalization Demo
Shows how nyc-geo-toolkit normalizes inconsistent layer names and geography
values into canonical forms.
cd examples/normalization-demo && uv run python main.py
Boundary Explorer Tearsheet
Interop showcase for the random-walks ecosystem. Loads community-district
boundaries via load_nyc_boundaries("community_district"), builds a synthetic
factor_factory.tidy.Panel with a TreatmentEvent, fits a two-way fixed-effects
DiD via factor_factory.engines.did.estimate(..., methods=("twfe",)), and
renders a factor_factory.jellycell.tearsheets.findings manuscript.
Pulls in factor-factory and jellycell — they are NOT default nyc-geo-toolkit dependencies, only extras for this example.
cd examples/boundary-explorer-tearsheet && uv sync && uv run python main.py
The synthetic outcome has a known 4.0-unit additive treatment effect, so the
fitted ATT should land near 4.0 — making this both a pattern demo and a smoke
test. Downstream packages (nyc311, subway-access) can follow the same
template with their real outcomes.